Posting on LinkedIn without checking your analytics is like driving with the windshield painted over. The numbers tell you whether your content is reaching the right people, whether they care, and what to do more (or less) of next.
The problem is that LinkedIn throws a wall of numbers at you with almost no explanation. This guide breaks down LinkedIn post analytics in plain English: what each metric means, which ones actually matter, and how to turn them into better posts.
Where to Find Your Post Analytics
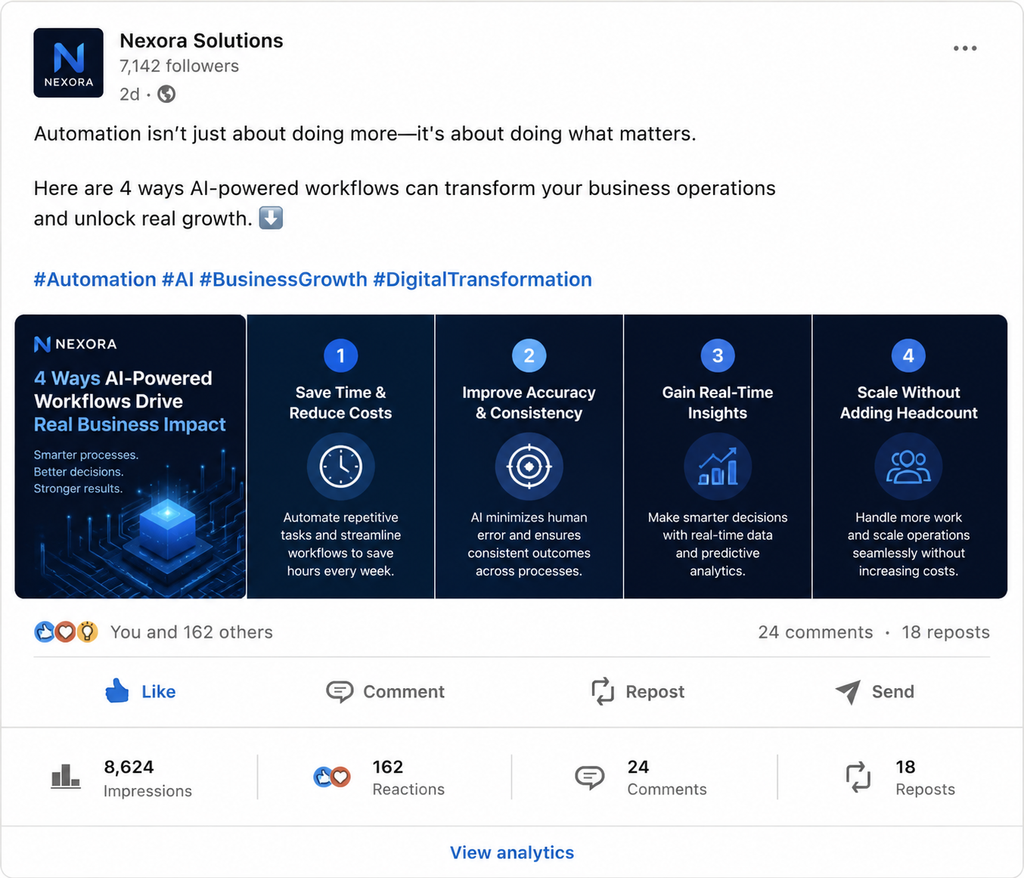
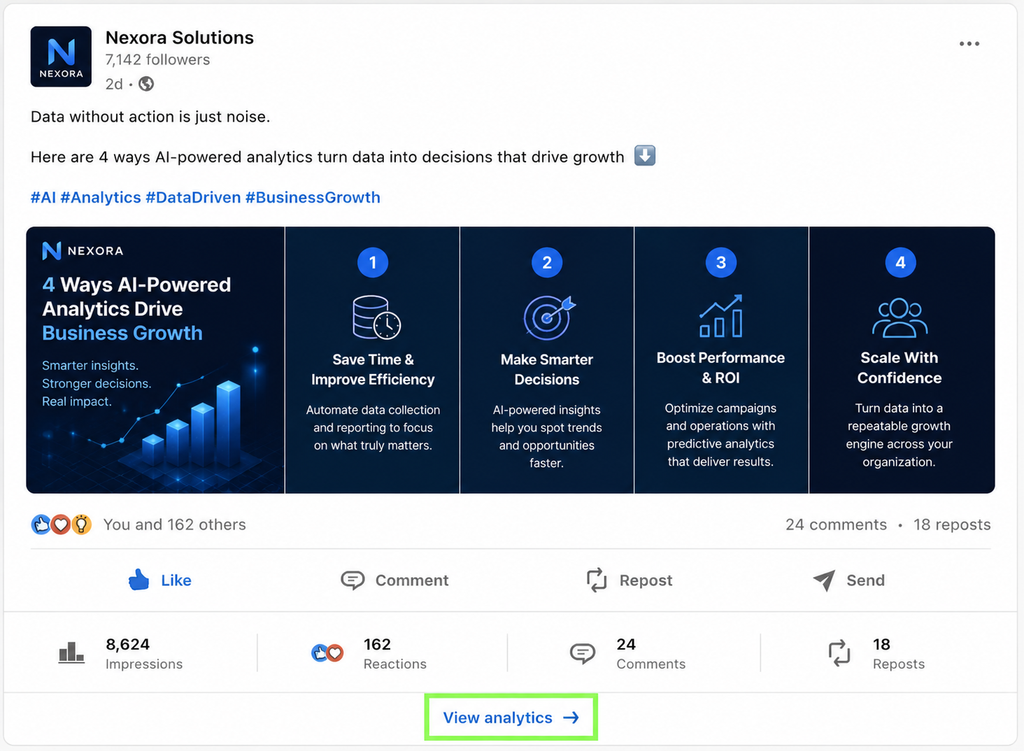
Under any of your posts, click “View analytics” (or tap the impressions count). You’ll see a breakdown for that specific post. For your overall profile, scroll to the Analytics section just below your bio, where you’ll find Profile Views, Post Impressions, and Search Appearances.
The LinkedIn Post Metrics That Actually Matter
Impressions
How many times your post appeared on someone’s screen. It doesn’t require a click or a like, just a scroll-past counts. Impressions are your first signal: if they’re low, nothing else can happen. (For a deep dive, see [What Are LinkedIn Impressions].)
Members reached
The number of unique people who saw your post. This is where a lot of confusion starts: impressions are usually higher than members reached, because some people see your post more than once. If 100 people see it and 20 see it twice, that’s 120 impressions but 100 members reached.
Engagement (reactions, comments, reposts)
What people did after seeing it. Comments are the strongest signal, someone cared enough to type. Reposts spread your reach. Reactions are the lightest touch. LinkedIn’s algorithm weighs meaningful comments far more heavily than likes.
Engagement rate
The summary metric. Roughly: (reactions + comments + reposts + clicks) divided by impressions. It tells you, quickly, whether a post prompted action.
Benchmarks for 2026:
- Personal profiles: around 2% is solid, 2 to 5% is strong, above 5% is excellent.
- Company pages: 1 to 3% is typical.
Treat these as a starting line, not a verdict. The real question is always: is this post beating my own normal baseline?
Profile visits and followers gained
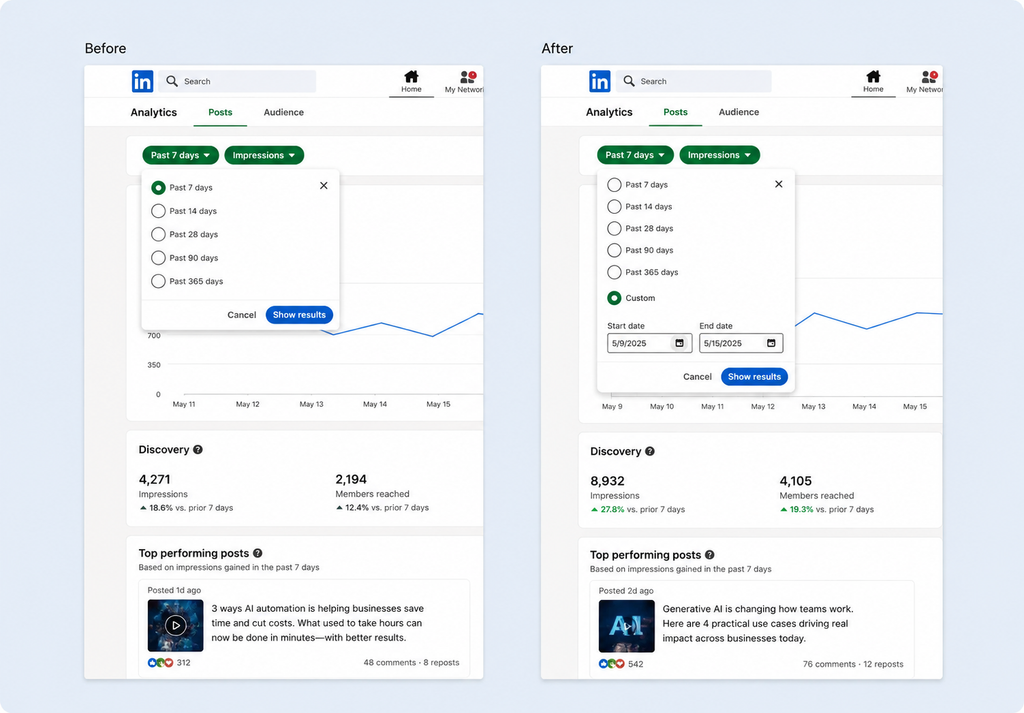
LinkedIn now surfaces how many profile visits and new followers a post generated. These sit closer to real outcomes (audience growth, inbound interest) than impressions alone, so watch them.
🕊️ Straight from the flock
Content analytics and outreach analytics are two halves of the same picture. Your posts tell you which topics and angles resonate with your audience; that’s gold for your outreach messaging. If a post about “avoiding LinkedIn bans” outperforms everything else, that pain point belongs in your first-touch message too. Inside PigeonScout, we pair this with reply, acceptance, and open-rate analytics so you can see the whole funnel: what draws attention and what starts conversations. Read both, and your outreach gets sharper every week.
How to Actually Use the Data
Numbers are useless without action. Here’s how to read them like a strategist:
Look for patterns, not one-off wins
Don’t obsess over a single viral post. Look across your recent posts for what consistently works: which topics, formats, and opening lines keep showing up in your best performers. That pattern is your real content strategy, drawn from your own data instead of generic advice.
Diagnose where a post broke down
- Low impressions? Your hook, format, or timing needs work; the algorithm didn’t distribute it.
- High impressions, low engagement? People saw it but didn’t care. The topic reached them; the content didn’t land.
- Good engagement, no profile visits? People enjoyed it but weren’t curious about you. Tighten your hook or your positioning.
Check who you’re reaching
For company pages and creator accounts, demographics show the top job titles, industries, and locations engaging with you. If you’re reaching the wrong people, that’s a targeting or topic problem worth fixing fast.
Build a 10-Minute Weekly Review Habit
Once a week, spend ten minutes:
- Note your top post and ask why it worked (topic, format, hook).
- Note your weakest post and ask what to change.
- Check whether profile views and followers are trending up.
- Write down one thing to do more of next week.
That’s it. This small habit is what separates people who grow on purpose from people who post into the void.
Metrics You Can Mostly Ignore
- Raw follower count as a vanity number (engagement matters more).
- Impressions in isolation (always pair with engagement).
- A single post’s performance (trends beat one-offs).
Frequently Asked Questions
How do I see analytics for a LinkedIn post? Click “View analytics” (or the impressions count) beneath any of your posts. For overall stats, use the Analytics section just below your profile bio: Profile Views, Post Impressions, and Search Appearances.
What’s the difference between impressions and members reached? Impressions count every time your post is displayed, including repeat views. Members reached counts unique people. Impressions are usually higher because some people see your post more than once.
What is a good engagement rate on LinkedIn in 2026? For personal profiles, around 2% is solid, 2 to 5% is strong, and above 5% is excellent. Company pages typically run 1 to 3%. Compare against your own baseline more than any fixed number.
Do my own views count in my post analytics? Yes, viewing your own posts can add to your impressions, so don’t read too much into small numbers inflated by your own scrolling.
Which LinkedIn metric matters most? It depends on your goal, but engagement rate is the best quick read on whether a post prompted action, and comments are the highest-value form of engagement.
The Bottom Line
Reading your LinkedIn post analytics isn’t about admiring likes. It’s about spotting patterns, diagnosing what’s working, and doing more of it. Build the ten-minute weekly habit, and every month your content (and the audience it builds) gets stronger.
👉 Read next: [What Are LinkedIn Impressions (And How to Get More)] and [What to Post on LinkedIn: Ideas That Get Engagement].
🕊️ See your whole funnel, not just your feed
Great content builds an audience; great outreach turns it into pipeline. PigeonScout gives you reply, acceptance, and open-rate analytics alongside safe, human-paced LinkedIn and email outreach, so you can see exactly what starts conversations. [See how it works →]